Colleges
- American Athletic
- Atlantic Coast
- Big 12
- Big East
- Big Ten
- Colonial
- Conference USA
- Independents (FBS)
- Junior College
- Mountain West
- Northeast
- Pac-12
- Patriot League
- Pioneer League
- Southeastern
- Sun Belt
- Army
- Charlotte
- East Carolina
- Florida Atlantic
- Memphis
- Navy
- North Texas
- Rice
- South Florida
- Temple
- Tulane
- Tulsa
- UAB
- UTSA
- Boston College
- California
- Clemson
- Duke
- Florida State
- Georgia Tech
- Louisville
- Miami (FL)
- North Carolina
- North Carolina State
- Pittsburgh
- Southern Methodist
- Stanford
- Syracuse
- Virginia
- Virginia Tech
- Wake Forest
- Arizona
- Arizona State
- Baylor
- Brigham Young
- Cincinnati
- Colorado
- Houston
- Iowa State
- Kansas
- Kansas State
- Oklahoma State
- TCU
- Texas Tech
- UCF
- Utah
- West Virginia
- Illinois
- Indiana
- Iowa
- Maryland
- Michigan
- Michigan State
- Minnesota
- Nebraska
- Northwestern
- Ohio State
- Oregon
- Penn State
- Purdue
- Rutgers
- UCLA
- USC
- Washington
- Wisconsin
High Schools
- Illinois HS Sports
- Indiana HS Sports
- Iowa HS Sports
- Kansas HS Sports
- Michigan HS Sports
- Minnesota HS Sports
- Missouri HS Sports
- Nebraska HS Sports
- Oklahoma HS Sports
- Texas HS Hoops
- Texas HS Sports
- Wisconsin HS Sports
- Cincinnati HS Sports
- Delaware
- Maryland HS Sports
- New Jersey HS Hoops
- New Jersey HS Sports
- NYC HS Hoops
- Ohio HS Sports
- Pennsylvania HS Sports
- Virginia HS Sports
- West Virginia HS Sports
ADVERTISEMENT
You are using an out of date browser. It may not display this or other websites correctly.
You should upgrade or use an alternative browser.
You should upgrade or use an alternative browser.
OT: bidets
- Thread starter NebChicago
- Start date
Do they do anything for speed bumps?Bidets reduce anal itching and abrasions by 95%+.

You don't wanna see them while I'm at work.
First thing I do after coming home is finish the job the TP failed to do.
anal warts will need an acid hookup lineDo they do anything for speed bumps?

Do they make these for dogs? It is literally my pet peeve when he drags his ass across the carpet like it’s a giant piece of toilet paper.
You could wipe him to help...Do they make these for dogs? It is literally my pet peeve when he drags his ass across the carpet like it’s a giant piece of toilet paper.
sorry, it was my attempt at a joke, but bidets are nothing to joke about.. 100% legit and way more sanitary.If you’re leaving skid marks using a bidet then your bidet isn’t doing what you think it is. They’re a joke.
It's a well known fact you'll get 96.438% of your money back on one of these when you sell your home.
No.sorry, it was my attempt at a joke, but bidets are nothing to joke about.. 100% legit and way more sanitary.
he’s dragging his ass to empty his nasty stinky anal glands.Do they make these for dogs? It is literally my pet peeve when he drags his ass across the carpet like it’s a giant piece of toilet paper.
I think it's kind of shitty.....This may be the best thread ever
For the unheated versions, how does that cold water feel on the old arsehole in January? Feel good after a hot one?
TOTO SW3036R#01 WASHLET K300. Don’t skimp on your butt. Buy the best. If you shop around and are patient price is often around $500. (It does everything but auto open/close and turn on a light, which I didn’t want. Has almost “unlimited” warm water, warm seat, warm air dry, deodorizer etc.. Electrician must extend power to wall next to toilet.) As for any posts here that say the top end models don’t work well, that’s B.S. as the entire very clean population of Japan can attest.
Last edited:
refreshing like a sierra mistFor the unheated versions, how does that cold water feel on the old arsehole in January? Feel good after a hot one?
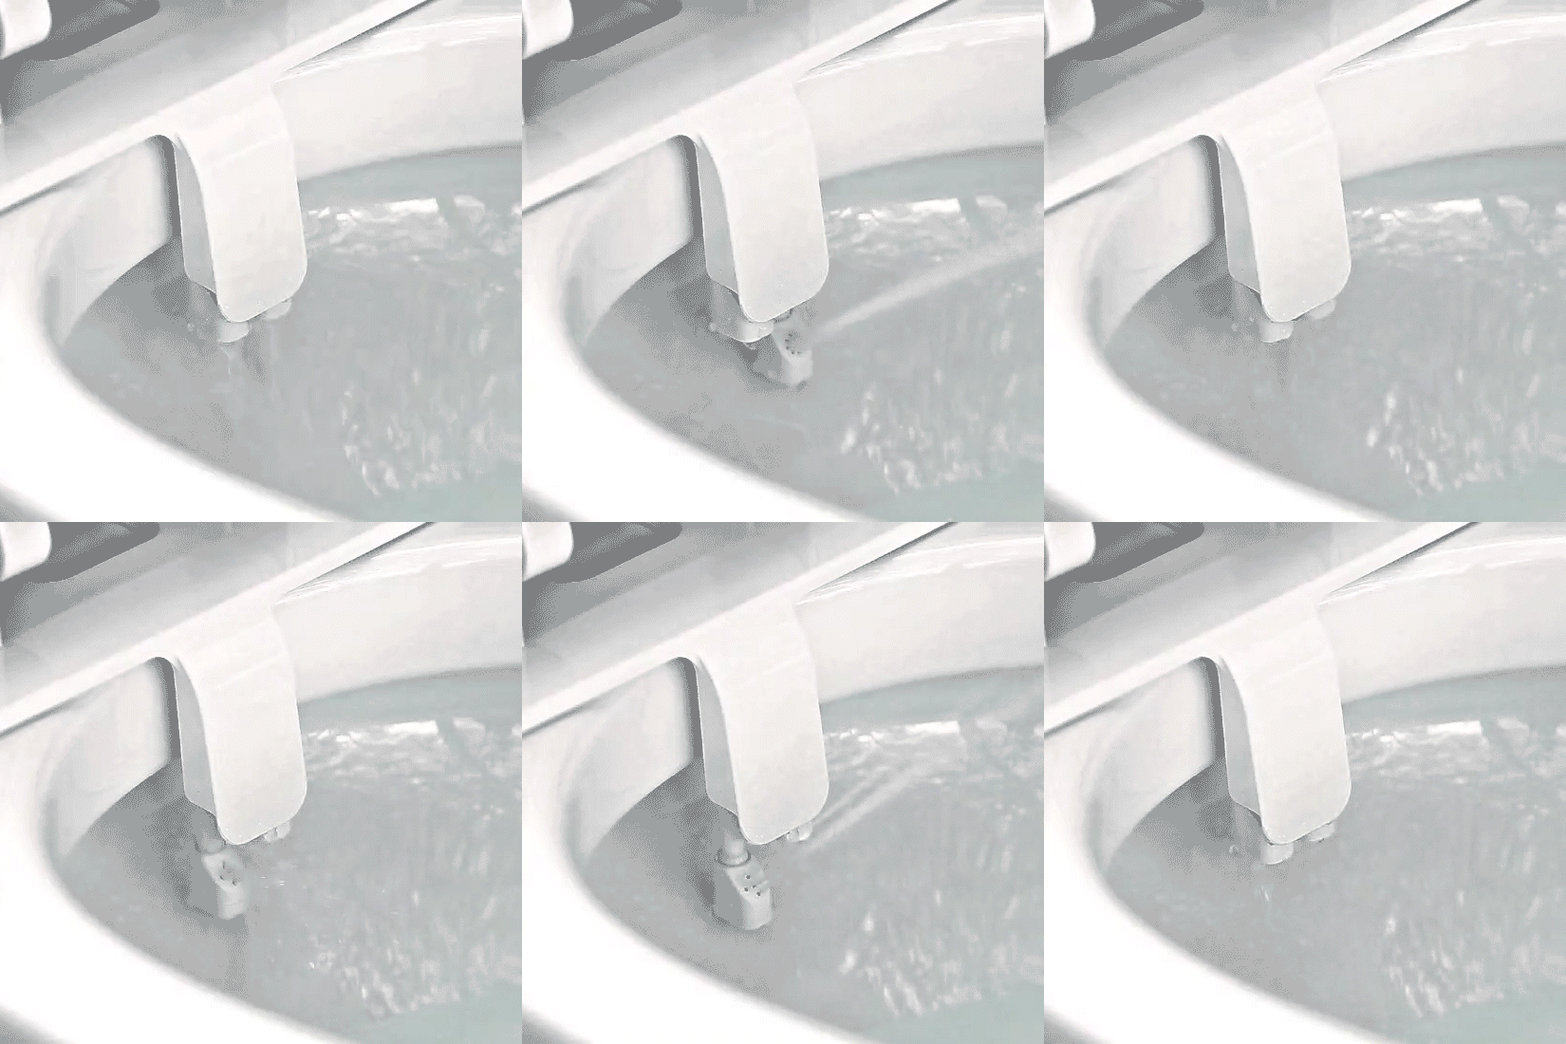
The crap falls on the bidet and gets all over it. It HAS to, right? Then theres someone elses crap resuidue on it that youre blowing up into your butthole?It's kinda like taking a shower.
Wouldn't taking a shower just wash all the dirt onto your feet?
When you blast your ass, the water goes down from betwixt the ass cheeks. Nature's pocket contains the dookie butter and the water washes into the toilet while toilet paper just spreads it all over the place like stinky peanut butter.

And again is it a wand? How is it accurate? Does water get on the toilet?
Im not against the bidet, I just cant comprehend it. Mind blown.
Correct and yes. A bunch of bidet heathens in this thread. Streaming is for digital, not arses.The crap falls on the bidet and gets all over it. It HAS to, right? Then theres someone elses crap resuidue on it that youre blowing up into your butthole?
And again is it a wand? How is it accurate? Does water get on the toilet?
Im not against the bidet, I just cant comprehend it. Mind blown.
When I was in Argentina a few years ago our hotel bathroom had a bidet, and my asshole felt amazing the hole trip. Then on prime day saw one of those bidets built into a toilet seat and thought about buying it
Anyone own a bidet and have an opinion?
Only if you sit way way back and intentionally aim for it, and even then, it would be very difficult. The nozzle retracts when no water is used.The crap falls on the bidet and gets all over it. It HAS to, right? Then theres someone elses crap resuidue on it that youre blowing up into your butthole?
And again is it a wand? How is it accurate? Does water get on the toilet?
Im not against the bidet, I just cant comprehend it. Mind blown.

Just got this model during prime days…

.

.
Any self-respecting man has a crapper in the basement that no one else uses! I know I do.Then theres someone elses crap resuidue on it that youre blowing up into your butthole?
Is that the @scopeandtime model?😂Just got this model during prime days…

.
What is wrong with you-all. Do you not trim your nethers with a weed wacker?
Buy a cheap one that requires no batteries. Cold water. Takes 20 minutes to install and join the dark side. Either you will be turned our you lost like $30.
Buy a cheap one that requires no batteries. Cold water. Takes 20 minutes to install and join the dark side. Either you will be turned our you lost like $30.
But cold water will not remove peanut butter from a plate or butter from a knife.What is wrong with you-all. Do you not trim your nethers with a weed wacker?
Buy a cheap one that requires no batteries. Cold water. Takes 20 minutes to install and join the dark side. Either you will be turned our you lost like $30.
Feces shouldn't be that oily.But cold water will not remove peanut butter from a plate or butter from a knife.
We are not melting the waste.But cold water will not remove peanut butter from a plate or butter from a knife.
Shoulder surgeries are in my wife and I future. Just bought the Toto 450 all in one toilet- bidet combo. I’ve never used one before but it seems Husker Land has spoken.
No, cold water just bonds the paste more tightly to the arse.We are not melting the waste.
For the guy who said high-end models work, as "clean" Japanese can attest, he obviously has never done the wet wipe test afterwards. I have tried all the high end units, including those in Japan, and my wet wipes did not lie.
There's a reason why Japanese men wear Sumo belts -- the Mark Mangino thing -- and the women wear loose-fitting kimonos. Gross.
The internet of things.Just got this model during prime days…

.
Or is it the thing of the internet?
I cure my ear wax, shape it into loaded dice and sell them to crooks. It's how I rage against the machine.We are not melting the waste.
I am beaming with pride that I began this thread

True, but waste is like paste. Sorry, I am not an ass spraying expert.We are not melting the waste.
Go to costco and pick up a brondell bidet seatWhat brand/model? You recommend the ones you have?
Bud, I'm going to share this with you and only you - no one else look!Is that the @scopeandtime model?😂
import timeit
start = timeit.default_timer()

from fredapi import Fred
import pandas as pd
import numpy as np
import matplotlib.pyplot as plt
import time, scipy.stats
import datetime as dt
from scipy.interpolate import interp1d
from sklearn.metrics import mean_squared_error
import statsmodels.formula.api as smf
import statsmodels.api as sm
from statsmodels.tsa.seasonal import seasonal_decompose
from log_progress import *
from sklearn.model_selection import train_test_split
import inspect
import matplotlib.pyplot as plt
import statsmodels.api as sm
from scipy import stats
from pmdarima import auto_arima
from pmdarima.arima import auto_arima
import warnings

from statsmodels.tools.sm_exceptions import ConvergenceWarning
warnings.simplefilter('ignore', ConvergenceWarning)

fred = Fred(api_key=<FRED api key>)
pd.set_option('display.max_colwidth', None)
pd.set_option('display.max_rows', 500)
pd.set_option('display.max_columns', 999)

import matplotlib.style as style
style.use('fivethirtyeight')

print('(_)_)IIIIIIIIIIIIIIIIIIIIIIIIIIIIIIIIIIIIIID')

import warnings
warnings.filterwarnings("ignore", category=FutureWarning)
def FredDataPull(series_id_list, ob_start, ob_end, units, frequency, aggregation_method):
    all_data = {'SeriesDate':[], 'SeriesID':[],'Measure':[]}
    for series_id in log_progress(series_id_list, every = 1):
        df = pd.DataFrame(fred.get_series(series_id
                                      ,observation_start = ob_start
                                      ,observation_end = ob_end
                                      ,units = units
                                      ,frequency = frequency
                                      ,aggregation_method = aggregation_method
                                     )

                      ,columns=['Measure'])
        time.sleep(1)
        [idx.strftime('%Y-%m-%d') for idx in df.index]
        df = df.reset_index()
        df.columns = ['SeriesDate', 'Measure']
        for items in df.values:
            all_data['SeriesDate'].append(items[0])
            all_data['Measure'].append(items[1])
            all_data['SeriesID'].append(series_id)
    df = pd.DataFrame(all_data)
    df_pivot = df.pivot(columns = 'SeriesID', index='SeriesDate', values='Measure')
    return df_pivot

def auto_arimathon(series_id, startdate, enddate, units, freq, agg_method, column_name, arima_freq):
    data = FredDataPull(series_id_list = [series_id]
                       ,ob_start = startdate
                       ,ob_end = enddate
                       ,units = units
                       ,frequency = freq
                       ,aggregation_method = agg_method)
    data.dropna(inplace = True)
    data.reset_index(inplace = True)
    data.columns = ['SeriesDate', column_name]
    df = data.dropna().set_index('SeriesDate')
    y = np.array(df[column_name])

    full_model = auto_arima(y, d=1, D=1, max_p=7, max_q=7,
                       max_P=7, max_Q=7, max_d=7, max_D=7,
                       max_order=7, m=arima_freq, seasonal=True,
                       error_action='ignore',suppress_warnings=True
                       #, exogenous = exog
                        #,n_jobs = -1
                      )

    print(full_model.summary())

    periods = 12
    preds = full_model.predict(n_periods=12)
    return preds
    print('\n',preds)

def control_chart(series_id, startdate, enddate, series_units,series_freq, agg_method, sigma):
    df = FredDataPull(series_id_list = [series_id]
                       ,ob_start = startdate
                       ,ob_end = enddate
                       ,units = series_units
                       ,frequency = series_freq
                       ,aggregation_method = agg_method)
    df.dropna(inplace = True)

    mean = df[series_id].mean()
    std = df[series_id].std()

    upper_bound = mean + (sigma * std)
    lower_bound = mean - (sigma * std)


    fig, ax = plt.subplots(figsize=(16, 9))
    df[series_id].plot(ax=ax, color='blue', linewidth=2)
    ax.axhline(df[series_id].mean(), color='black', linewidth=1)
    ax.fill_between(df.index, upper_bound, lower_bound, color='white')
    ax.set_xlabel('Date')
    ax.set_ylabel(series_id)
    ax.grid(False)
    plt.title('Control Chart - '+str(series_id), fontsize = 12)
    plt.show();

chart_start_date = '2022-01-01'
next_date = '2023-07-01'

PPI = auto_arimathon(series_id = 'PPIFIS'
               ,startdate = None
               ,enddate = None
               ,units = 'lin'
               ,freq = 'm'
               ,agg_method = 'eop'
               ,column_name = 'PPI'
               ,arima_freq = 12)

FF = auto_arimathon(series_id = 'FEDFUNDS'
               ,startdate = None
               ,enddate = None
               ,units = 'lin'
               ,freq = 'm'
               ,agg_method = 'eop'
               ,column_name = 'PPI'
               ,arima_freq = 12)

WTI = auto_arimathon(series_id = 'DCOILWTICO'
               ,startdate = None
               ,enddate = None
               ,units = 'lin'
               ,freq = 'm'
               ,agg_method = 'eop'
               ,column_name = 'PPI'
               ,arima_freq = 12)

data = FredDataPull(series_id_list = ['CPIAUCSL', 'PPIFIS', 'FEDFUNDS', 'DCOILWTICO']
                       ,ob_start = None
                       ,ob_end = None
                       ,units = 'lin'
                       ,frequency = 'm'
                       ,aggregation_method = 'eop')
data.dropna(inplace = True)
data.reset_index(inplace = True)

df = data.dropna().set_index('SeriesDate')
df['year'] = df.index.year
df['month'] = df.index.month
y = np.array(df['CPIAUCSL'])

exog = np.array(df[['PPIFIS', 'FEDFUNDS', 'DCOILWTICO']])

full_model = auto_arima(y, d=1, D=1, max_p=12, max_q=12,
                   max_P=12, max_Q=12, max_d=12, max_D=12,
                   max_order=12, m=12, seasonal=True,
                   error_action='ignore',suppress_warnings=True
                   , exogenous = exog
                   #,n_jobs = -1
                  )

print(full_model.summary());

exog_data = {'PPIFIS': PPI,
             'FEDFUNDS': FF,
             'DCOILWTICO': WTI
            }

exog_df = pd.DataFrame(exog_data)
dt_index = pd.date_range(start=latest_date, periods=12, freq='MS')
exog_df['SeriesDate'] = dt_index
exog_df.set_index('SeriesDate', inplace = True)
exog = np.array(exog_df[['PPIFIS', 'FEDFUNDS', 'DCOILWTICO']])
periods = 12
preds = full_model.predict(n_periods=12, exogenous = exog)
exog_df['PredCPI'] = preds
exog_df = exog_df[['PPIFIS', 'FEDFUNDS', 'DCOILWTICO', 'PredCPI']]
exog_df.columns = ['PPIFIS', 'FEDFUNDS', 'DCOILWTICO', 'CPIAUCSL']
exog_df

df = df[['PPIFIS', 'FEDFUNDS', 'DCOILWTICO', 'CPIAUCSL']]

full_df = pd.concat([df, exog_df], axis=1)
df_grouped = full_df.groupby(full_df.columns, axis= 1)
df_merged = df_grouped.first()
df_merged.tail(13);


df_merged['CPI_12moPrev'] = df_merged['CPIAUCSL'].shift(12)
df_merged['Pred_CPI_Cng'] = df_merged['CPIAUCSL'] - df_merged['CPI_12moPrev']
df_merged['PredYoYInflation'] = (df_merged['Pred_CPI_Cng'] / df_merged['CPI_12moPrev'])*100
final_df = df_merged.tail(12)[['CPIAUCSL', 'PredYoYInflation']]
final_df.columns = ['Predicted CPI', 'Predicted YoY %']
final_df;

mask = df_merged.index < pd.to_datetime(latest_date)

fig, (ax1, ax2) = plt.subplots(2, 1, figsize=[24, 16])

df_merged.PredYoYInflation[mask].plot(linestyle='-', linewidth=3, color='#E24A33', ax=ax1)
df_merged.PredYoYInflation[~mask].plot(linestyle='--', linewidth=3, color='#348ABD', ax=ax1)

ax1.set_title("Inflation Prediction\n" , fontsize=14)
ax1.set_xlabel('')
ax1.set_ylabel('\nCPI YoY Change\n', fontsize=14)
ax1.tick_params(axis='both', which='major', labelsize=12)
ax1.legend(['Actual YoY Inflation', 'Predicted YoY Inflation'], fontsize=10)
ax1.grid(axis='x')

df_merged_recent = df_merged[df_merged.index >= chart_start_date]
mask = df_merged_recent.index < pd.to_datetime(latest_date)
df_merged_recent.PredYoYInflation[mask].plot(linestyle='-', linewidth=3, color='#E24A33', ax=ax2)
df_merged_recent.PredYoYInflation[~mask].plot(linestyle='--', linewidth=3, color='#348ABD', ax=ax2)

ax2.set_xlabel('Date\n', fontsize=14)
ax2.set_ylabel('CPI YoY Change\n', fontsize=12)
ax2.tick_params(axis='both', which='major', labelsize=12)
ax2.grid(axis='x')
plt.savefig('CPI.jpg')

end = timeit.default_timer()
print('Time elapsed (min): ', (end - start)/60)
Is that the secret location coordinates to all your truck stop glory holes? 😂Bud, I'm going to share this with you and only you - no one else look!
import timeit
start = timeit.default_timer()

from fredapi import Fred
import pandas as pd
import numpy as np
import matplotlib.pyplot as plt
import time, scipy.stats
import datetime as dt
from scipy.interpolate import interp1d
from sklearn.metrics import mean_squared_error
import statsmodels.formula.api as smf
import statsmodels.api as sm
from statsmodels.tsa.seasonal import seasonal_decompose
from log_progress import *
from sklearn.model_selection import train_test_split
import inspect
import matplotlib.pyplot as plt
import statsmodels.api as sm
from scipy import stats
from pmdarima import auto_arima
from pmdarima.arima import auto_arima
import warnings

from statsmodels.tools.sm_exceptions import ConvergenceWarning
warnings.simplefilter('ignore', ConvergenceWarning)

fred = Fred(api_key=<FRED api key>)
pd.set_option('display.max_colwidth', None)
pd.set_option('display.max_rows', 500)
pd.set_option('display.max_columns', 999)

import matplotlib.style as style
style.use('fivethirtyeight')

print('(_)_)IIIIIIIIIIIIIIIIIIIIIIIIIIIIIIIIIIIIIID')

import warnings
warnings.filterwarnings("ignore", category=FutureWarning)
def FredDataPull(series_id_list, ob_start, ob_end, units, frequency, aggregation_method):
    all_data = {'SeriesDate':[], 'SeriesID':[],'Measure':[]}
    for series_id in log_progress(series_id_list, every = 1):
        df = pd.DataFrame(fred.get_series(series_id
                                      ,observation_start = ob_start
                                      ,observation_end = ob_end
                                      ,units = units
                                      ,frequency = frequency
                                      ,aggregation_method = aggregation_method
                                     )

                      ,columns=['Measure'])
        time.sleep(1)
        [idx.strftime('%Y-%m-%d') for idx in df.index]
        df = df.reset_index()
        df.columns = ['SeriesDate', 'Measure']
        for items in df.values:
            all_data['SeriesDate'].append(items[0])
            all_data['Measure'].append(items[1])
            all_data['SeriesID'].append(series_id)
    df = pd.DataFrame(all_data)
    df_pivot = df.pivot(columns = 'SeriesID', index='SeriesDate', values='Measure')
    return df_pivot

def auto_arimathon(series_id, startdate, enddate, units, freq, agg_method, column_name, arima_freq):
    data = FredDataPull(series_id_list = [series_id]
                       ,ob_start = startdate
                       ,ob_end = enddate
                       ,units = units
                       ,frequency = freq
                       ,aggregation_method = agg_method)
    data.dropna(inplace = True)
    data.reset_index(inplace = True)
    data.columns = ['SeriesDate', column_name]
    df = data.dropna().set_index('SeriesDate')
    y = np.array(df[column_name])

    full_model = auto_arima(y, d=1, D=1, max_p=7, max_q=7,
                       max_P=7, max_Q=7, max_d=7, max_D=7,
                       max_order=7, m=arima_freq, seasonal=True,
                       error_action='ignore',suppress_warnings=True
                       #, exogenous = exog
                        #,n_jobs = -1
                      )

    print(full_model.summary())

    periods = 12
    preds = full_model.predict(n_periods=12)
    return preds
    print('\n',preds)

def control_chart(series_id, startdate, enddate, series_units,series_freq, agg_method, sigma):
    df = FredDataPull(series_id_list = [series_id]
                       ,ob_start = startdate
                       ,ob_end = enddate
                       ,units = series_units
                       ,frequency = series_freq
                       ,aggregation_method = agg_method)
    df.dropna(inplace = True)

    mean = df[series_id].mean()
    std = df[series_id].std()

    upper_bound = mean + (sigma * std)
    lower_bound = mean - (sigma * std)


    fig, ax = plt.subplots(figsize=(16, 9))
    df[series_id].plot(ax=ax, color='blue', linewidth=2)
    ax.axhline(df[series_id].mean(), color='black', linewidth=1)
    ax.fill_between(df.index, upper_bound, lower_bound, color='white')
    ax.set_xlabel('Date')
    ax.set_ylabel(series_id)
    ax.grid(False)
    plt.title('Control Chart - '+str(series_id), fontsize = 12)
    plt.show();

chart_start_date = '2022-01-01'
next_date = '2023-07-01'

PPI = auto_arimathon(series_id = 'PPIFIS'
               ,startdate = None
               ,enddate = None
               ,units = 'lin'
               ,freq = 'm'
               ,agg_method = 'eop'
               ,column_name = 'PPI'
               ,arima_freq = 12)

FF = auto_arimathon(series_id = 'FEDFUNDS'
               ,startdate = None
               ,enddate = None
               ,units = 'lin'
               ,freq = 'm'
               ,agg_method = 'eop'
               ,column_name = 'PPI'
               ,arima_freq = 12)

WTI = auto_arimathon(series_id = 'DCOILWTICO'
               ,startdate = None
               ,enddate = None
               ,units = 'lin'
               ,freq = 'm'
               ,agg_method = 'eop'
               ,column_name = 'PPI'
               ,arima_freq = 12)

data = FredDataPull(series_id_list = ['CPIAUCSL', 'PPIFIS', 'FEDFUNDS', 'DCOILWTICO']
                       ,ob_start = None
                       ,ob_end = None
                       ,units = 'lin'
                       ,frequency = 'm'
                       ,aggregation_method = 'eop')
data.dropna(inplace = True)
data.reset_index(inplace = True)

df = data.dropna().set_index('SeriesDate')
df['year'] = df.index.year
df['month'] = df.index.month
y = np.array(df['CPIAUCSL'])

exog = np.array(df[['PPIFIS', 'FEDFUNDS', 'DCOILWTICO']])

full_model = auto_arima(y, d=1, D=1, max_p=12, max_q=12,
                   max_P=12, max_Q=12, max_d=12, max_D=12,
                   max_order=12, m=12, seasonal=True,
                   error_action='ignore',suppress_warnings=True
                   , exogenous = exog
                   #,n_jobs = -1
                  )

print(full_model.summary());

exog_data = {'PPIFIS': PPI,
             'FEDFUNDS': FF,
             'DCOILWTICO': WTI
            }

exog_df = pd.DataFrame(exog_data)
dt_index = pd.date_range(start=latest_date, periods=12, freq='MS')
exog_df['SeriesDate'] = dt_index
exog_df.set_index('SeriesDate', inplace = True)
exog = np.array(exog_df[['PPIFIS', 'FEDFUNDS', 'DCOILWTICO']])
periods = 12
preds = full_model.predict(n_periods=12, exogenous = exog)
exog_df['PredCPI'] = preds
exog_df = exog_df[['PPIFIS', 'FEDFUNDS', 'DCOILWTICO', 'PredCPI']]
exog_df.columns = ['PPIFIS', 'FEDFUNDS', 'DCOILWTICO', 'CPIAUCSL']
exog_df

df = df[['PPIFIS', 'FEDFUNDS', 'DCOILWTICO', 'CPIAUCSL']]

full_df = pd.concat([df, exog_df], axis=1)
df_grouped = full_df.groupby(full_df.columns, axis= 1)
df_merged = df_grouped.first()
df_merged.tail(13);


df_merged['CPI_12moPrev'] = df_merged['CPIAUCSL'].shift(12)
df_merged['Pred_CPI_Cng'] = df_merged['CPIAUCSL'] - df_merged['CPI_12moPrev']
df_merged['PredYoYInflation'] = (df_merged['Pred_CPI_Cng'] / df_merged['CPI_12moPrev'])*100
final_df = df_merged.tail(12)[['CPIAUCSL', 'PredYoYInflation']]
final_df.columns = ['Predicted CPI', 'Predicted YoY %']
final_df;

mask = df_merged.index < pd.to_datetime(latest_date)

fig, (ax1, ax2) = plt.subplots(2, 1, figsize=[24, 16])

df_merged.PredYoYInflation[mask].plot(linestyle='-', linewidth=3, color='#E24A33', ax=ax1)
df_merged.PredYoYInflation[~mask].plot(linestyle='--', linewidth=3, color='#348ABD', ax=ax1)

ax1.set_title("Inflation Prediction\n" , fontsize=14)
ax1.set_xlabel('')
ax1.set_ylabel('\nCPI YoY Change\n', fontsize=14)
ax1.tick_params(axis='both', which='major', labelsize=12)
ax1.legend(['Actual YoY Inflation', 'Predicted YoY Inflation'], fontsize=10)
ax1.grid(axis='x')

df_merged_recent = df_merged[df_merged.index >= chart_start_date]
mask = df_merged_recent.index < pd.to_datetime(latest_date)
df_merged_recent.PredYoYInflation[mask].plot(linestyle='-', linewidth=3, color='#E24A33', ax=ax2)
df_merged_recent.PredYoYInflation[~mask].plot(linestyle='--', linewidth=3, color='#348ABD', ax=ax2)

ax2.set_xlabel('Date\n', fontsize=14)
ax2.set_ylabel('CPI YoY Change\n', fontsize=12)
ax2.tick_params(axis='both', which='major', labelsize=12)
ax2.grid(axis='x')
plt.savefig('CPI.jpg')

end = timeit.default_timer()
print('Time elapsed (min): ', (end - start)/60)
Run the code!Is that the secret location coordinates to all your truck stop glory holes? 😂
Similar threads
- Replies
- 12
- Views
- 1K
- Replies
- 17
- Views
- 838
- Replies
- 123
- Views
- 3K
- Replies
- 9
- Views
- 3K
ADVERTISEMENT
ADVERTISEMENT


